I have a question for you.
If you played 18 holes of golf and never kept score, how would you know if you were getting better?
You would not. You might feel like you had a good round, but you would have no way to compare it to last month, last year, or the round you played with your buddy who claims he shot a 78. Without a scorecard, it is all just a guess.
That is exactly what it is like to invest in marketing without tracking your results.
Over the years, our team has worked with hundreds of small businesses, and the single most common problem we find is not a bad website, not a weak ad campaign, and not a lack of content. It is a lack of tracking. The business owner is investing real money in marketing, but has no way to know what is actually working.
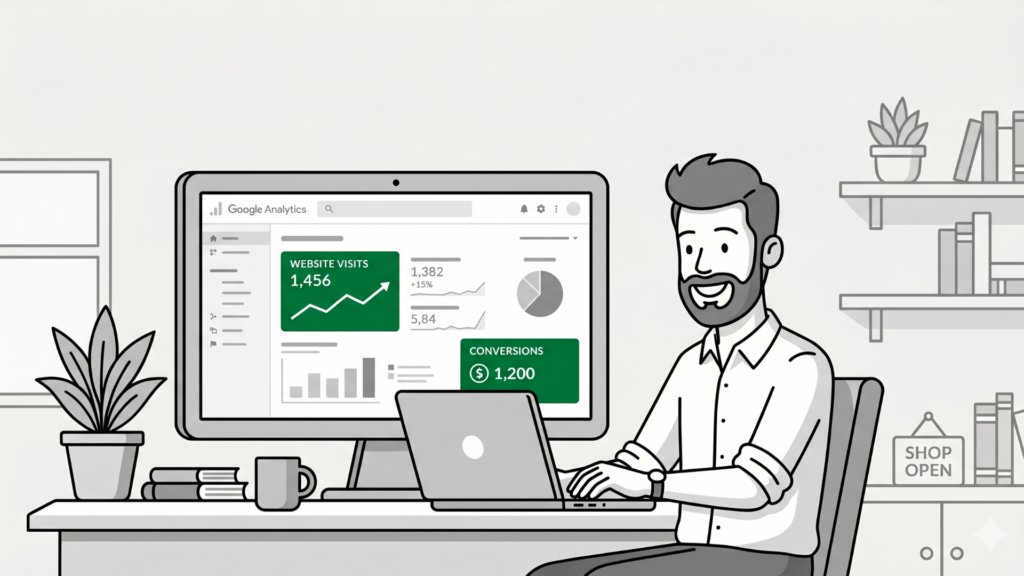
Google Analytics is the scorecard. It is free, it connects to almost everything, and when it is set up correctly it tells you exactly where your leads and customers are coming from. But the key phrase is “set up correctly,” because most small businesses either do not have it installed at all, or have it installed but are not tracking the things that actually matter.
Why Tracking Is the Foundation
In The Growth Formula we teach that growth comes from three levers: Traffic, Conversion, and Customer Value. But underneath all three of those levers is a foundation: Tracking.
Without tracking, you cannot answer the most basic questions about your marketing. How many people visited your website last month? Where did they come from? How many of them filled out a form or called you? Which marketing channel generated the most leads? Which one generated the most customers?
If you cannot answer those questions, you are making every marketing decision based on gut feel. And gut feel, with all due respect, is not a strategy.
Your website platform may have some built-in analytics, and those can give you surface-level numbers like total visits. But they cannot connect traffic to conversions, break down performance by marketing channel, or tell you which campaigns are generating real leads. For that, you need Google Analytics.
The good news is that setting up proper tracking is not complicated. Google Analytics 4 (GA4) is free, and for most small businesses the setup takes a few hours, not a few weeks. The harder part is knowing what to pay attention to once it is running.
What to Track (and What to Ignore)
Google Analytics gives you access to an enormous amount of data, and that is actually part of the problem. Many business owners log in, see dozens of reports and charts, feel overwhelmed, and log out. Nothing changes.
The fix is to focus on a small number of metrics that directly connect to your business goals. Here is what we recommend for most small businesses.
Website Traffic
Start with how many people are visiting your website each month. This is the top of your Growth Formula. If nobody is coming to your site, nothing else matters.
But total traffic alone is not enough. You need to know where the traffic is coming from. GA4 breaks this down by channel: organic search, paid search, social media, email, direct, and referral. This tells you which marketing channels are actually driving visitors and which ones are not pulling their weight.
When we review analytics with clients, we look at traffic trends month over month. A slow upward trend in organic traffic, for example, tells us that an SEO campaign is working even before we see a big jump in leads. A sudden drop in traffic from one channel tells us something broke and needs attention.
Conversions
Traffic without conversions is just vanity. The most important thing Google Analytics can tell you is how many visitors took a meaningful action on your website.
For most small businesses, there are two types of conversions to track:
Form submissions. Contact forms, quote request forms, appointment booking forms. Every time someone fills out a form on your website, GA4 should record it as a conversion.
Phone calls. For service businesses, phone calls are often the primary way leads come in. At a minimum, set up click-to-call event tracking in GA4 so you can see when mobile visitors tap your phone number. For more complete call tracking that works across all devices and shows you which marketing channel generated each call, you will need a dedicated call tracking tool like CallRail or Convirza that sends events to GA4 every time the phone rings. For a deeper look at how call tracking works without hurting your SEO, read our article on Dynamic Number Insertion.
E-commerce orders. If you sell products online, GA4 can also track purchases and revenue. Most website platforms like Shopify and WooCommerce have built-in integrations that make this easy to turn on.
Once conversions are set up, you can answer the question that matters most: which marketing channels are generating leads? Not just traffic, but actual people who raised their hand and said they are interested. This is the data that tells you where to invest more and where to pull back.
Traffic Sources by Conversion
This is where tracking gets powerful. GA4 lets you see not just how many conversions you got, but which channels drove them.
You might find that organic search drives 60% of your traffic but 80% of your conversions. That tells you your SEO investment is working even better than the traffic numbers suggest. Or you might find that social media drives a lot of traffic but very few conversions, which means the traffic is not the right audience or the landing experience needs work.
When our team manages campaigns for clients, this is the report we review most often. It is the direct connection between marketing spend and business results.
The Most Common Tracking Mistakes
Over the years, we have seen the same mistakes come up again and again when we audit a small business’s analytics setup.
No conversion tracking at all
This is by far the most common one. GA4 is installed and recording traffic, but nobody set up conversion events for forms or phone calls. The business owner can see how many people visited the site, but has no idea how many became leads. It is like counting how many people walked past your store without counting how many walked in.
Tracking the wrong things
Some businesses track every button click, every scroll, every page view as a “conversion.” When everything is a conversion, nothing is. Focus on the actions that actually indicate someone wants to do business with you.
Not filtering out internal traffic
If your team visits your own website regularly (and they should), that traffic inflates your numbers. GA4 allows you to filter out traffic from your office IP address so your reports reflect real visitor behavior.
Not connecting Google Ads
If you are running Google Ads, your GA4 account should be linked to your Google Ads account. This lets you see the full picture from ad click to website visit to conversion, all in one place. Without this connection, your Google Ads data and your analytics data live in separate silos.
Not connecting Google Search Console
Search Console shows you which keywords are driving organic traffic to your site, how often your pages appear in search results, and which pages are performing best in Google. Linking it to GA4 gives you a much clearer picture of how your SEO is performing. If you are investing in SEO and have not connected Search Console, you are missing one of the most useful free reports available.
Checking too often or not often enough
Logging in every day and reacting to daily fluctuations is a recipe for bad decisions. Ignoring analytics for six months means problems go unnoticed. For most small businesses, a monthly review is the right cadence. Look at trends, not individual days.
How to Use the Data
Having the data is only half the job. The other half is actually using it to make decisions.
We recommend a simple monthly rhythm. Set aside 30 minutes once a month to review three things:
Traffic trends. Is overall traffic growing, flat, or declining? Are any channels trending in the wrong direction?
Conversion volume. How many leads came in this month compared to last month? Is the trend moving in the right direction?
Channel performance. Which channels are driving the most conversions per dollar spent? Is the mix shifting?
If something looks off, dig deeper. If everything looks on track, keep doing what you are doing. The scorecard does not need to be complicated. It just needs to be consistent.
Start with the Foundation
If you do not have Google Analytics set up on your website, start there. It is free, and your web developer or marketing team can install it in an afternoon.
If you already have GA4 installed but have not set up conversion tracking, that is your next step. Until you are tracking conversions, you are playing 18 holes without keeping score.
And if you have everything in place but never look at the data, block 30 minutes on your calendar once a month. That single habit will make you a better marketer than most of your competitors.
Tracking is the foundation. Everything else in your marketing strategy builds on top of it.
Need Help with Your Marketing?
If you want help setting up your tracking or making sense of your analytics data, request a free strategy call and our team will take a look at where you stand.


